Sentry
Sentry is an open-source error tracking tool that helps developers monitor and fix crashes in real time. Sentry provides a platform for monitoring and fixing application crashes and errors. It provides a real-time view of errors and crashes in your application, and allows you to fix them as they occur.
SkyU supports Sentry to provide you API insights and error tracking for your projects. This guide will walk you through the process of linking your Sentry to your SkyU project.
Create Sentry Credential
Navigate to Project Settings
To initiate linking Sentry integrations with your project, first, select a project within your organization. Navigate to Settings -> Integrations ->Other to view all existing credentials.
Click on + Integration to introduce a new Sentry credential into your project.
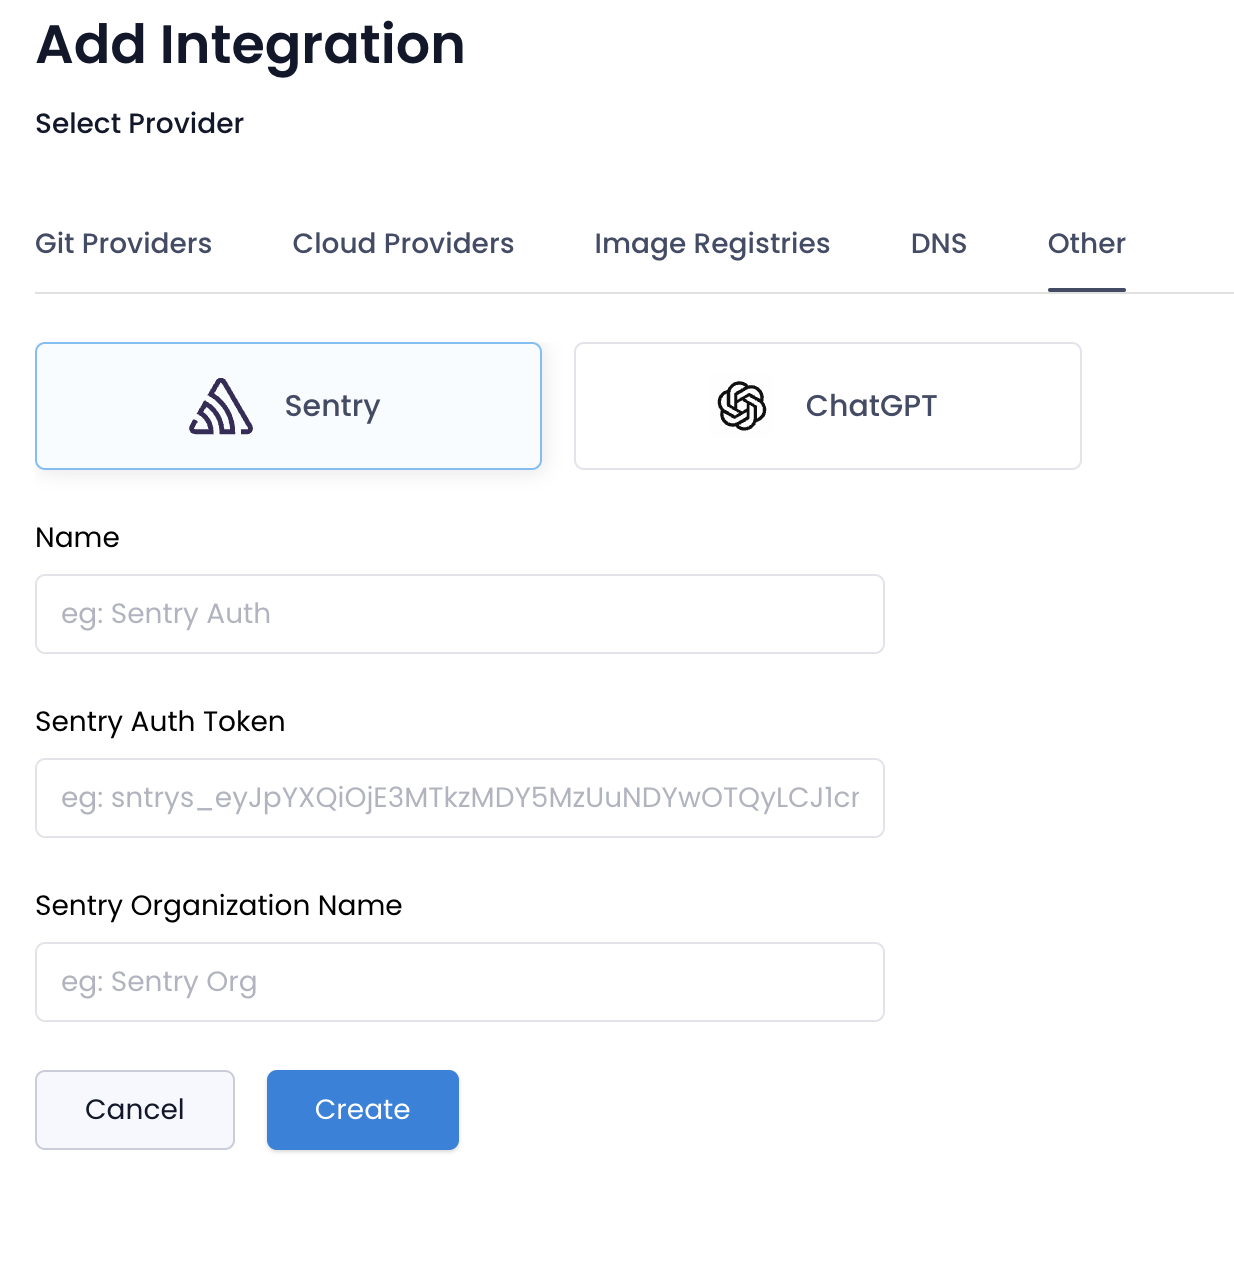
Add Credential
When linking a Sentry resource, you are required to provide the following details:

| Field | Description |
|---|---|
| Name | Name of the Sentry Credential. This is for your reference. |
| Sentry Auth Token | Please refer Create Sentry Auth Token (opens in a new tab) |
| Sentry Organization Slug | The organization slug of the Sentry project. |
Finally select Create button to save the credential.
Sentry Insights
Once you've configured your Sentry integration, SkyU provides powerful performance insights for your applications through the Insights section.
Accessing Sentry Insights
Navigate to Insights → Sentry in your project to view detailed performance metrics for your applications.
Available Metrics
Sentry Insights provides two main views:
API Calls Performance
Monitor and analyze your API endpoints with the following metrics:
- P50 (ms): Median response time - 50% of requests complete faster than this value
- P95 (ms): 95th percentile response time - 95% of requests complete faster than this value
- Endpoint URL: The specific API endpoint being monitored
Page Load Performance
Track frontend performance with metrics for page navigation:
- P50 (ms): Median page load time
- P95 (ms): 95th percentile page load time
- Page Route: The specific page route being monitored
Filtering Options
Customize your insights view with the following filters:
- Sentry Projects: Select one or multiple Sentry projects to analyze
- Environments: Filter by environment (production, staging, development, etc.)
- Stats Period: Choose the time range for your analysis (24h, 7d, 14d, 30d, or All Time)
- P95() Duration (ms): Filter endpoints/pages by minimum P95 response time threshold
Understanding Performance Metrics
P50 vs P95: While P50 shows the median performance, P95 is crucial for understanding worst-case scenarios. A high P95 indicates that a significant portion of your users experience slow response times.
Use these insights to:
- Identify slow API endpoints and pages
- Track performance improvements over time
- Compare performance across different environments
- Prioritize optimization efforts based on real user data
Best Practices
- Regular Monitoring: Check Sentry Insights regularly to catch performance regressions early
- Set Thresholds: Use the P95 duration filter to focus on endpoints that exceed your performance budget
- Environment Comparison: Compare production vs staging environments to validate optimizations
- Track Trends: Monitor the same endpoints over different time periods to measure improvement